Matplotlib 3Dプロット、meshgrid とは?
3Dプロット(mplot3d) 、 meshgrid とは?
始め何やっているのかわからなかったので、どうしてそうなっているのか羅列していきます

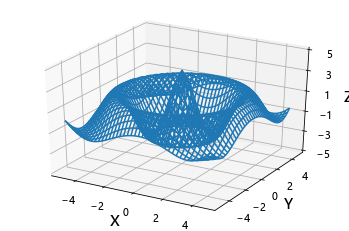
こんな感じのプロットはどのように描かれているのか?
次の式に従って描かれたのが上の図です
では、上から眺めたらどうなるでしょうか?

Z軸が少し傾いていますね

XYプロットで、描かせるとこんな感じです。どういうことでしょうか?
グラフを手で書くときには、ある点のに対して座標に沿ってポイントを打っていき、その間を補完する意味で繋げます。

ドットだけ打った図はこんな感じになります。これを上から見てY軸に沿ってドットをつないでいき。次にX軸に沿ってドットをつないでいきます。
これを横から見るとZX座標、ZY座標


こんな感じになります。式に対してYの値を振った図とXの値を振った図になります。つまり、パラメータが3つあっても、1つを固定すれば点と点をつなぐことができることを意味します。
mashgridについて
次に、実際に3Dプロットするときに何が必要になるか。すぐ、頭に浮かぶのはZの値がわかればいい。単純にそうでしょうか? 少し単純化して5x5の範囲で線を引く場合を考えていきます

Z=X+Y
の式からZの値は決まりますが、これをplot(X,Y,Z)とやってもプロットしてくれません(いまのところ)。なぜでしょうか?どういう風に点と点をつないでいくかがわからないからです。逆に言うと、線のつなぎ方はいろいろとあるのです。これから行う線の引き方は、z(x1,y1)→z(x2,y2)にせんを引く3Dプロットです。これに対して、numpyライブラリは便利な関数を持っています。meshgridです。
x = [0 1 2 3 4]
y = [0 1 2 3 4]
5x5の範囲なのでx,yを用意します
X, Y = np.meshgrid(x, y)
実行すると

このような配列を作ってくれます。はじめなんじゃこれは?と思っていたのですが、こういうことです


X,Y,Zすべての要素が決まったことになり、これに対してZXグラフとZYグラフを書く準備ができたということです。
1~5までは、Y軸を固定にしてX軸に沿って線を引いていきます。次に、6~10は、X軸を固定してY軸に沿って線を引いていきます。
この要領でプロットするのがplot_wireframeになります。
実際のソース
import numpy as np
import matplotlib.pyplot as plt
from mpl_toolkits.mplot3d import axes3d


# 配列の要素数
n = 5
x = np.linspace(0, 4, n)
y = np.linspace(0, 4, n)
print("x =",x)
print("y =",y,"\n")

# 5×5の格子点を作成
X, Y = np.meshgrid(x, y)
R = np.sqrt(X**2 + Y**2) #原点からの長さ
Z = 4*np.pi/(np.pi+R)*np.cos(np.pi*R/2)

np.set_printoptions(precision=3, suppress=True)
print("Xサイズ ",X.shape)
print("X =",X,"\n")
print("Yサイズ ",Y.shape)
print("Y =",Y,"\n")
print("Zサイズ ",Y.shape)
print("Z =",Z,"\n")
print("X=3")
print("X[:,3] =",X[:,3])
print("Y[:,3] =",Y[:,3])
print("Z[:,3] =",Z[:,3])
print("\n")
print("Y=3")
print("X[3,:] =",X[3,:])
print("Y[3,:] =",Y[3,:])
print("Z[3,:] =",Z[3,:])
x = [0. 1. 2. 3. 4.]
y = [0. 1. 2. 3. 4.]

Xサイズ  (5, 5)
X = [[0. 1. 2. 3. 4.]
 [0. 1. 2. 3. 4.]
 [0. 1. 2. 3. 4.]
 [0. 1. 2. 3. 4.]
 [0. 1. 2. 3. 4.]]

Yサイズ  (5, 5)
Y = [[0. 0. 0. 0. 0.]
 [1. 1. 1. 1. 1.]
 [2. 2. 2. 2. 2.]
 [3. 3. 3. 3. 3.]
 [4. 4. 4. 4. 4.]]

Zサイズ  (5, 5)
Z = [[ 4.     0.    -2.444 -0.     1.76 ]
 [ 0.    -1.671 -2.178  0.503  1.698]
 [-2.444 -2.178 -0.56   1.516  1.217]
 [-0.     0.503  1.516  1.58   0.   ]
 [ 1.76   1.698  1.217  0.    -1.226]]

X=3
X[:,3] = [3. 3. 3. 3. 3.]
Y[:,3] = [0. 1. 2. 3. 4.]
Z[:,3] = [-0.     0.503  1.516  1.58   0.   ]


Y=3
X[3,:] = [0. 1. 2. 3. 4.]
Y[3,:] = [3. 3. 3. 3. 3.]
Z[3,:] = [-0.     0.503  1.516  1.58   0.   ]
各要素毎に、5x5の配列で用意できてます。またNumpyですので、Z=f(X,Y)的な演算もそのままできて便利です。X=3の時は、X,Y,Zを使ってこの順で線を引きます。Y=3の時は、X,Y,Zを使ってこの順で線を引きます。
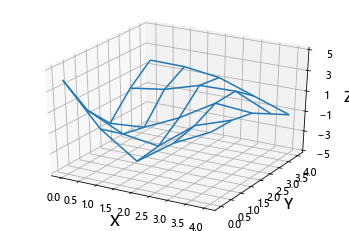
実際のプロット
from mpl_toolkits.mplot3d import Axes3D
import matplotlib.pyplot as plt
from matplotlib.ticker import LinearLocator, FormatStrFormatter
import numpy as np

# 配列の要素数
n = 5
x = np.linspace(0, 4, n)
y = np.linspace(0, 4, n)
print("x =",x)
print("y =",y,"\n")

# 5×5の格子点を作成
X, Y = np.meshgrid(x, y)
R = np.sqrt(X**2 + Y**2) #原点からの長さ
Z = 4*np.pi/(np.pi+R)*np.cos(np.pi*R/2)

fig = plt.figure()
ax = fig.gca(projection='3d')

wire = ax.plot_wireframe(X, Y, Z)

ax.set_xlabel("X", size = 15)
ax.set_ylabel("Y", size = 15)
ax.set_zlabel("Z", size = 15)

ax.set_zlim(-5, 5)
ax.zaxis.set_major_locator(LinearLocator(6))

plt.show()

格子が5x5なので少しガタガタしてますね。
from mpl_toolkits.mplot3d import Axes3D
import matplotlib.pyplot as plt
from matplotlib.ticker import LinearLocator, FormatStrFormatter
import numpy as np

fig = plt.figure()
ax = fig.gca(projection='3d')

X = np.arange(-5, 5, 0.25)
Y = np.arange(-5, 5, 0.25)
X, Y = np.meshgrid(X, Y)
R = np.sqrt(X**2 + Y**2) #原点からの長さ
Z = 4*np.pi/(np.pi+R)*np.cos(np.pi*R/2)

wire = ax.plot_wireframe(X, Y, Z)

ax.set_xlabel("X", size = 15)
ax.set_ylabel("Y", size = 15)
ax.set_zlabel("Z", size = 15)

ax.set_zlim(-5, 5)
ax.zaxis.set_major_locator(LinearLocator(6))

plt.show()

というわけで、3Dプロットはなにをやっているのか?mashgridは、何を作っているのか。また、その役割について話しました。