matplotlib の pcolor
%matplotlib inline
import matplotlib.pyplot as plt
import numpy as np
Z = 100*np.random.randn(64,256)
Z = np.where(Z < -256, -256, Z)
Z = np.where(Z > 255, 255, Z)
fig, (ax0, ax1) = plt.subplots(2, 1)
fig.dpi = 200
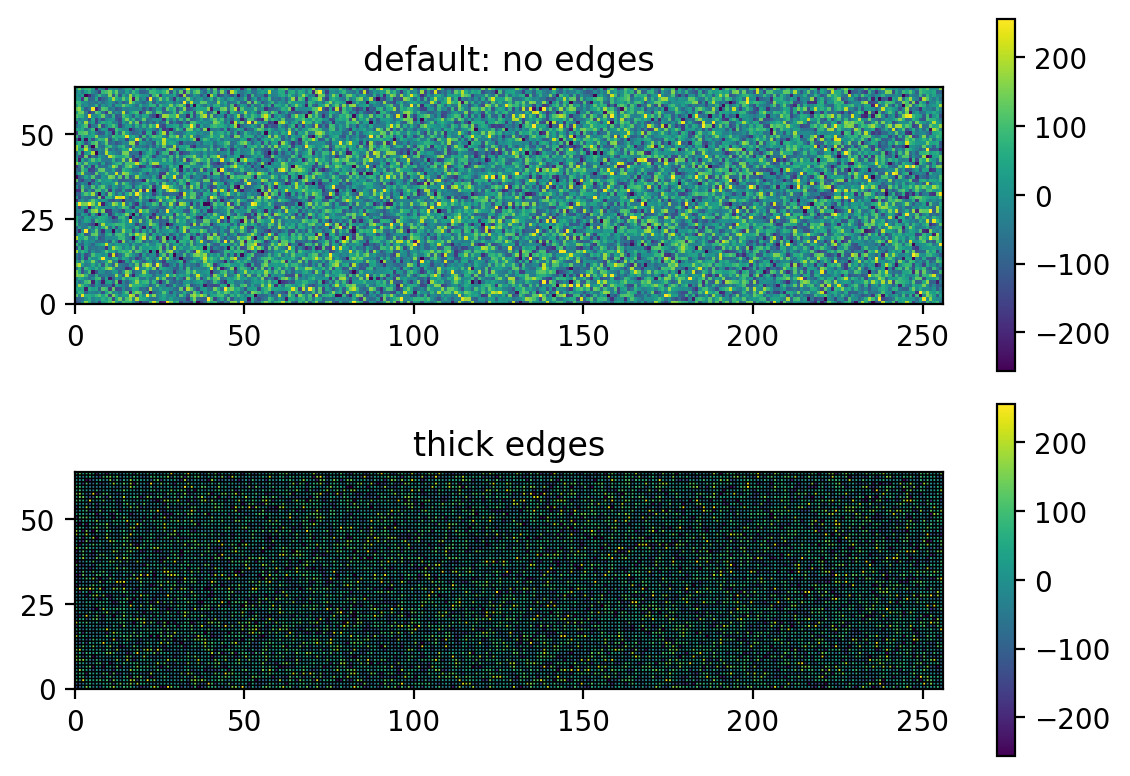
c = ax0.pcolor(Z)
ax0.set_aspect('equal')
ax0.set_title('default: no edges')
fig.colorbar(c, ax=ax0)
c = ax1.pcolor(Z, edgecolors='k', linewidths=0.5)
ax1.set_title('thick edges')
ax1.set_aspect('equal')
fig.colorbar(c, ax=ax1)
fig.tight_layout()
plt.show()

%matplotlib inline
import matplotlib.pyplot as plt
import numpy as np
Z = 100*np.random.randn(64,256)
Z = np.where(Z < -256, -256, Z)
Z = np.where(Z > 255, 255, Z)
fig, ax = plt.subplots(2, 2)
fig.dpi = 200
ax2 = ax[1][0]
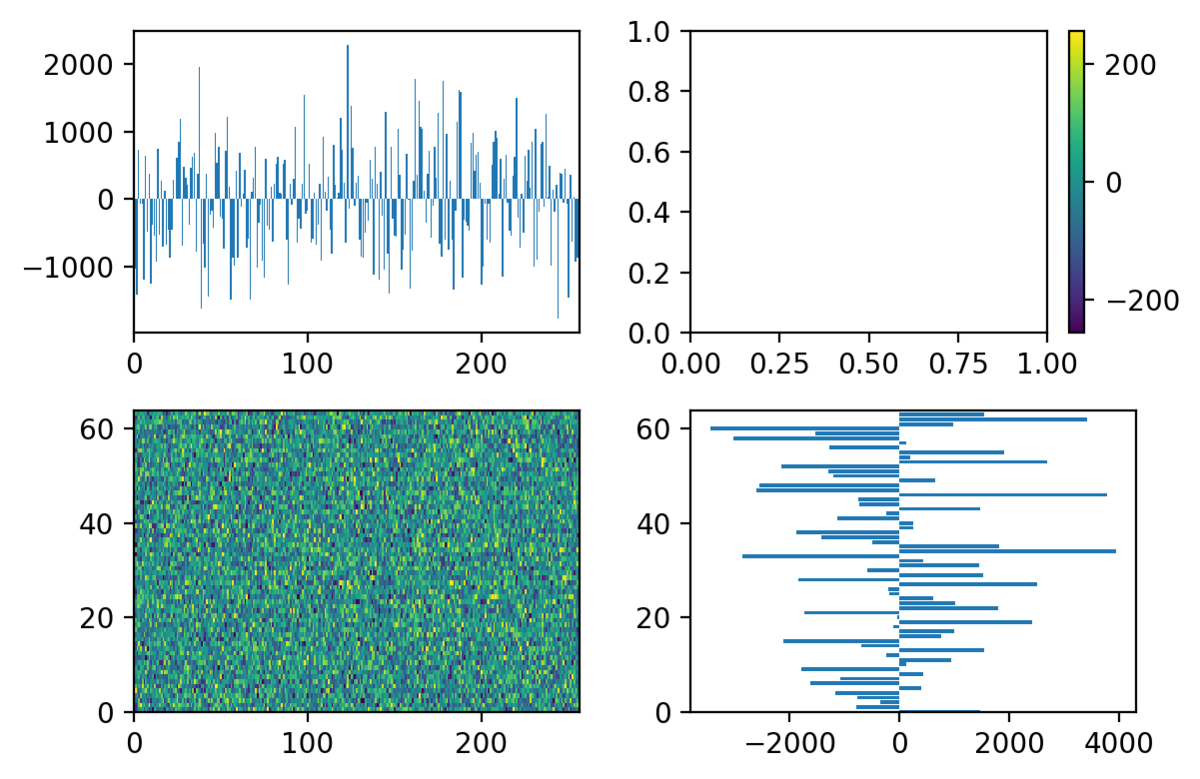
c = ax2.pcolor(Z)
ax1 = ax[0][1]
fig.colorbar(c, ax=ax1)
ax0 = ax[0][0]
c = ax0.bar(range(Z.shape[1]),np.sum(Z,axis=0))
ax0.set_xlim(ax2.get_xlim())
ax3 = ax[1][1]
c = ax3.barh(range(Z.shape[0]),np.sum(Z,axis=1))
ax3.set_ylim(ax2.get_ylim())
fig.tight_layout()
plt.show()


